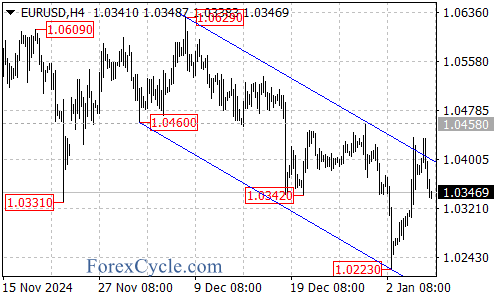
The EURUSD pair has recently exhibited significant volatility, with a notable bounce from the 1.0223 level, extending upwards to a high of 1.0436. This upward movement broke above the top of the falling price channel on the 4-hour chart, suggesting a potential shift in the trend dynamics.

Understanding the Breakout
The breakout above the falling price channel is a crucial indicator for traders. A falling price channel typically signifies a downtrend, with prices oscillating within a downward-sloping trend line. However, breaking above this channel can signal a reversal or at least a pause in the downtrend, indicating potential strength in the currency pair.
The Pullback and Correction
Despite the initial upward surge, the pair failed to breach the resistance level at 1.0458, leading to a pullback to 1.0338. This pullback suggests a corrective phase within the broader uptrend from 1.0223. Traders should view this as a consolidation period, where the market is likely to range between 1.0300 and 1.0458 in the coming days.
Key Support and Resistance Levels
- Support at 1.0300: As long as this level holds, the uptrend from 1.0223 is likely to resume. Traders should keep an eye on this level, as a breakdown could signal a shift in momentum.
- Resistance at 1.0458: A breakout above this level could pave the way for further gains, potentially targeting the 1.0530 area.
Potential Scenarios
- Uptrend Resumption: If the 1.0300 support holds, traders can expect the uptrend to continue, with a possible retest of the 1.0458 resistance. A successful breakout above this level could lead to a move towards 1.0530.
- Downside Breakout: A breakdown below 1.0300 could indicate a deeper correction, potentially testing the 1.0223 support and even aiming for the 1.0100 level.
