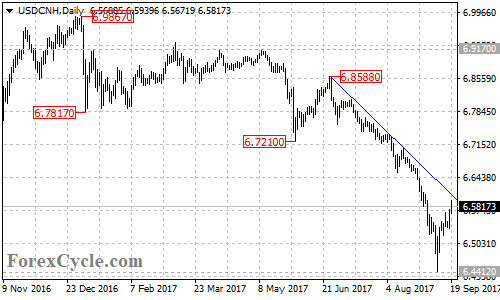
USDCNH rebounded sharply from 6.4412 after several months of steady decline, facing a major resistance trend line on its daily chart now at around 6.6060.

The trend line would act as the key resistance for the bearish movement from 6.8588. As long as the prices are below the trend line, the downside movement could be expected to continue, and another fall towards 6.3860 is still possible. At the same time, an upside break through the trend line could indicate that the bearish move had completed at 6.4412 already.
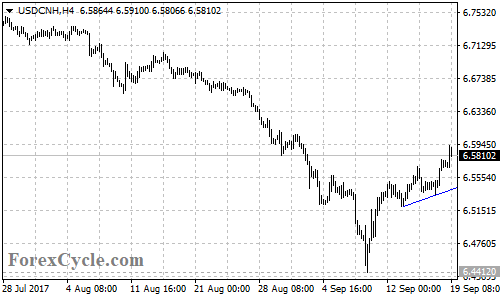
On the 4-hour chart, there is an ascending trend line now at 6.5400. As long as the trend line support holds, the short term uptrend from 6.4412 could be expected to continue, and a break through the 6.6060 resistance could take price to the support-turned-resistance level at 6.7210. On the downside, a breakdown below the trend line support could bring price back towards 6.4412. Below 6.4412 support could suggest that the downtrend from 6.8588 has resumed, then next target would be at the 61.8% Fibonacci retracement taken from 6.0152 to 6.9867 at around 6.3860.

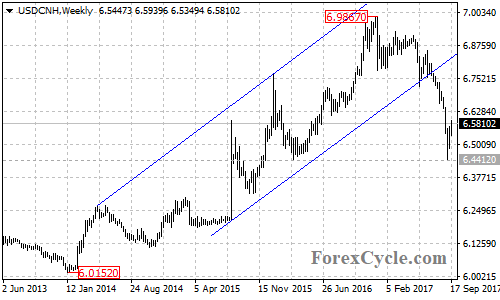
For long term analysis, the USDCNH pair remains in the long term uptrend from 6.0152, the fall from 6.9867 would possibly be correction of the uptrend. Above the trend line on the daily chart could signal completion of the whole correction pullback.

Technical levels
Support levels: 6.5400 (the ascending trend line on the 4-hour chart), 6.4412 (the September 8 low), 6.3860 (the 61.8% Fibonacci support).
Resistance levels: 6.6060 (the resistance trend line on the daily chart), 6.7210 (the June 1 low), 6.8588 (the June 26 high), 6.9170 (the important resistance on the daily chart), 6.9867 (the January 3 high), 7.0000 (the important psychological level).
