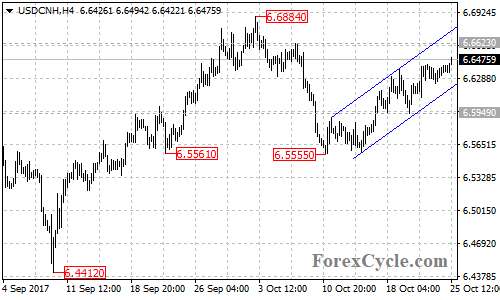
USDCNH stays in a rising price channel on the 4-hour chart and remains in the short term uptrend from 6.5555. As long as the price is in the channel, the upside movement could be expected to continue and next target would be at 6.6623, above this level could take price to next resistance level at 6.6884.

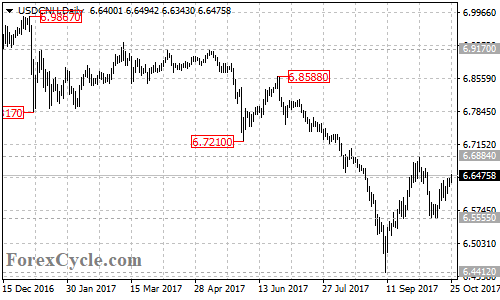
Breakthrough 6.6884 resistance will indicate that the longer term uptrend from 6.4412 has resumed, then next resistance level would be at 6.7210. A breakout of this level could trigger further upside move targeting next resistance level at 6.8588, followed by 6.9170.

Near term support is at the bottom trend line of the price channel on the 4-hour chart now at around 6.6200. Below the bottom support could bring price back to next support level at 6.5949. Breakthrough here if seen will indicate that lengthier correction for the uptrend from 6.4412 is needed, then the following downside movement could take price to 6.5555, followed by 6.4412 previous low.
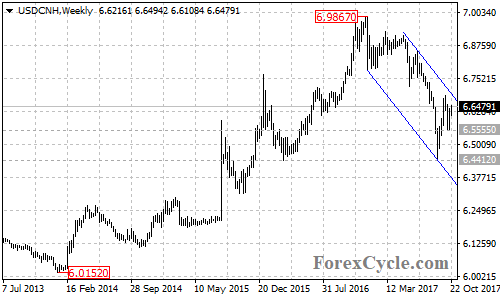
For long term analysis, the USDCNH pair traded in a descending price channel on the weekly chart. If the price fails to breakout of the top of the channel, the downside movement from 6.9867 could be expected to resume and one more fall towards 6.3860 is still possible. Key support level is at 6.5555, below this level could signal resumption of the downtrend. However, a clear break above the channel resistance will confirm that the downtrend from 6.9867 had completed at 6.4412 already.

Technical levels
Support levels: 6.6200 (the bottom trend line of the price channel on the 4-hour chart), 6.5949 (the October 20 low), 6.5555 (the October 11 low), 6.4412 (the September 8 low), 6.3860 (the 61.8% Fibonacci support).
Resistance levels: 6.6623 (the October 6 high), 6.6884 (the October 3 high), 6.7210 (the June 1 low), 6.8588 (the June 26 high), 6.9170 (the important resistance on the daily chart), 6.9867 (the January 3 high), 7.0000 (the important psychological level).

