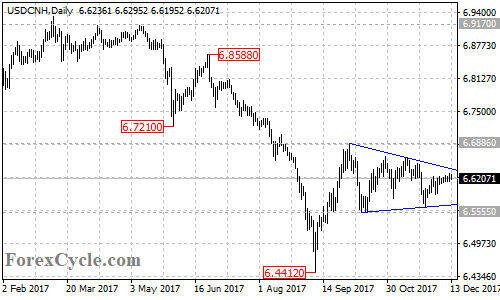
The USDCNH pair formed a triangle pattern on its daily chart for several weeks. All we can do is wait for a breakout to occur. The price is facing the upper line of the pattern now at around 6.6390. A breakout of this trend line could signal resumption of the uptrend from 6.4412.

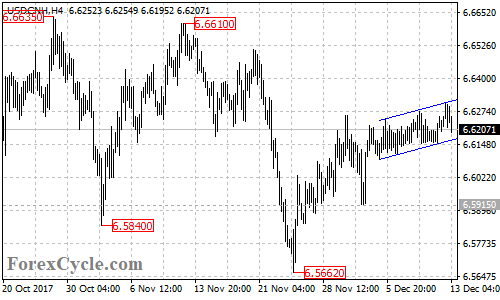
Let’s look into its 4-hour chart. There is rising channel with support at around 6.6165. As long as the channel support holds, the short term uptrend from 6.5662 could be expected to continue and next target would be at the top of the triangle pattern. A breakout of the pattern resistance could take price to next resistance level at 6.6635, followed by 6.6886.

Above 6.6886 resistance will confirm that the upside movement from 6.4412 has resumed, then the following upside movement could bring price to 6.8588, or even 6.9170.
On the other side, a clear break below the channel on the 4-hour chart will suggest that the short term uptrend from 6.5662 is complete, then deeper decline to next support level at 6.5915 could be seen. Below here would aim the bottom support trend line of the triangle patter now at around 6.5700.
A breakdown below the bottom of the pattern could take price to test 6.5555 support. Below here could trigger further downside movement towards 6.4412 previous low.
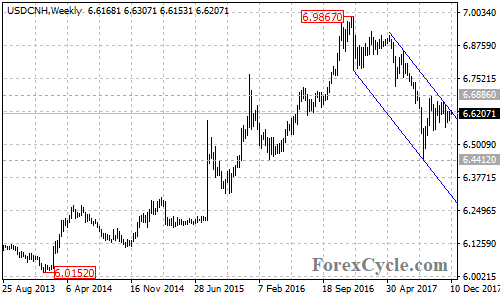
For long term analysis, the USDCNH pair stays in a falling price channel on its weekly chart, suggesting that the pair remains in the downtrend from 6.9867. As long as the price is in this channel, the downside move could be expected to continue, and a breakdown below 6.4412 support could take price to 6.3860 which is the 61.8% Fibonacci retracement taken from 6.0152 to 6.9867. Only a clear break above the price channel and 6.6886 resistance could signal completion of the long term downtrend.

Technical levels
Support levels: 6.6165, 6.5915, 6.5700, 6.5555, 6.4412, 6.3860.
Resistance levels: 6.6390, 6.6635, 6.6886, 6.8588, 6.9170, 6.9867, 7.0000.
