Support and resistance are respective price levels at which prices stop going down or up. Support levels indicate the price at which most traders believe that prices will move higher. Resistance levels indicate the place where the most of traders feel prices will move lower.
Trading ranges are formed by support and resistance levels. A trading range can play an important role in determining support and resistance as turning points or as continuation patterns. In a trading range, price fluctuates in a narrow band with no clear trend. Buyers take long positions when the prices move to the support level, and sellers go short at the resistance level.
Support and resistance does not always hold. A break below support level signals that the sellers have won out over the buyers, and bearish movement can be seen to follow. On the other side, a break above resistance level indicates that the bulls have won out over the bears, and the following uptrend can bring market price to a new high.
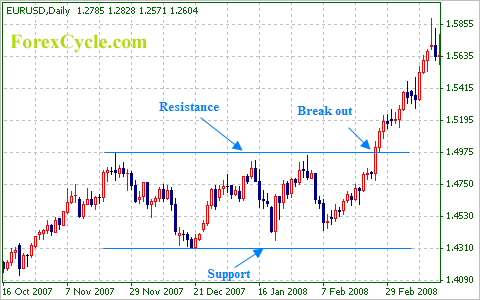
Here is an example in the forex market. Resistance for the EURUSD is located at 1.4975. The market bounces around below this level and forms a sideways consolidation for several weeks until both buyers and sellers think that fair rate of EURUSD is higher than 1.4975. The market breaks out of its trading range on 26-Feb-2008 and moves higher until most of the traders agree that fair rate is 1.5700.

Sometimes we can see the price pulls back to the previous resistance level, and then rally again. Why does such interesting thing happen? If the market trades back down to the previous resistance, buyers who missed the earlier breakout will see their second chance to go long. So the market rebounds up off this level which has now turned to support.

