A forex trader must master many analysis techniques and strategies to trade successfully. Studying chart pattern is one of the most common practices in Forex trading. These charts give reliable entry and exit points for the potential trade. Out of many kinds of charts, one of the most common patterns followed by the majority of traders is triangle pattern. It is liked and preferred by many as it is not only indicates good trade with low risk and high rewards, but also gives clear indications about the price objectives.
There are three types of triangle patterns commonly followed by the traders. Let’s discuss them one by one.
1. Symmetrical triangle pattern:
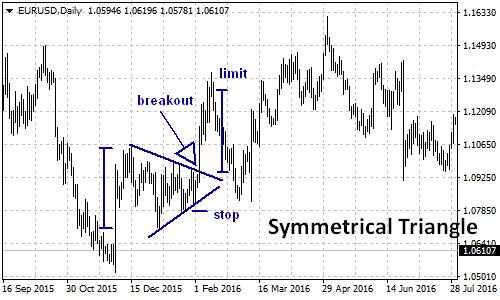
The first pattern is commonly known as the symmetrical triangle pattern. This kind of triangle pattern is result of the intersection of two trend lines of slopes similar to each other. The point of intersection of the trend lines is called the Apex. Usually in a symmetrical triangle, the rising trend line intersects with the down trend line. In case of a symmetrical triangle pattern, sellers cannot push the price of the currency lower and the buyers are unable to take the prices higher. Now all that happens is the coiling of the price between support and resistance which is termed “consolidation” in trading language. Due to consolidation, breakout is most likely to occur within the first 2/3 part of the triangle. This breakout is either above the trend line resistance or below the trend line support. As a result of which, either the buyers or the sellers take control over the trading day.

Once the traders recognize a symmetrical triangle pattern on the chart, all they must do is wait for the breakout to occur. After the breakout, a stop is placed approximately 10 pips below the last swing low in the chart. Traders usually place the limit equivalent to the height of the triangle.
2. Ascending triangle pattern:
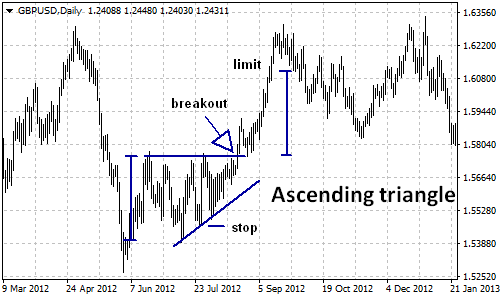
Another triangle pattern commonly seen on the charts of the forex market is the ascending triangle pattern. It is very easy to recognize and traders do not need to emancipate a lot before recognizing an ascending triangle pattern. An ascending triangle pattern is formed when the rising trend line intersects with a flat resistance line on the chart. Traders often regard it as a bullish pattern in the Forex market. This triangle pattern is often regarded as a breakout above resistance level on completion. However, it is not mandatory and breakout can take place below the resistance pattern too in case the trend before the triangle formation was a down trend. In short, the trader should not get excited seeing a rising trend as resistance may be too strong for the buyer to push the prices higher and breakout may occur below the resistance line. In most cases, when an ascending triangle pattern is formed, buyers win the battle defeating the resistance but in case the buyers loose the battle, it can easily be seen that drop in price is equivalent to the height of the triangle.

3. Descending triangle pattern:
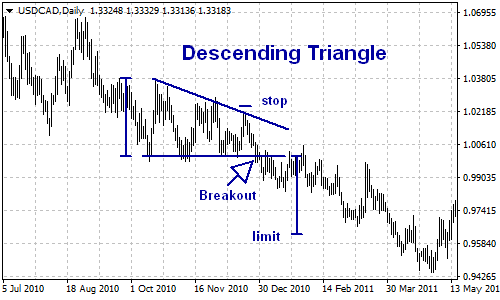
The last triangle formation in triangle trading patterns is the descending triangle pattern. It is contrary to the ascending triangle pattern as in the descending pattern a down trend line intersects with a flat yet solid support line. On recognition of such a pattern by the chartist, they wait and expect a further down trend line. This triangle pattern is usually confirmed by a breakout below the area of support or close below the area of support. This breakout is a signal for the traders to short their position and put a stop loss above the top of the triangle pattern. In such a triangle pattern, sellers have a stronger position compared to buyers. In the majority of cases, price of the currency breaks the support line to move further downwards, but in some cases, if the support line is too strong to be broken, the price of the currency can bounce back and reach new highs. It will then become a lost battle for the sellers. Usually, investors place the orders above the triangle top and set a target equivalent to height of the triangle pattern formation with aim of generating decent profits.

Triangle pattern trading can be a very good tool for the trader. Once you know how to read triangle patterns on the chart or you get an expert to read the patterns for you, it becomes quite simple and convenient to judge the movement of the currency. It not only helps you judge the movement of the currency, but also where to place the order, how much risk has to be taken, and how much profit can be expected from the trade.

